User guide
On this page, you will find documentation for the Swedish Reference Genome Portal, which provides a general overview of its graphical user interface, structure, and useful features.
We gratefully welcome comments or questions via email.
1. Website structure
The Genome Portal website mainly consists of a Home page, with a gallery of links to individual Species pages.
1.1. Home page
This is the landing page of the Genome Portal. It consists of three main components: navigation bar, search bar, and species cards (Figure 1).
The navigation bar includes links to various pages:
- Home: The main landing page of the Genome Portal website.
- Contribute: Instructions on how to submit data, definition of the Genome Portal’s scope, data requirements, supported file formats, and recommendations for making data files publicly available.
- User guide: An overview of the structure, content, and graphical user interface of the Genome Portal to help users understand how to make the best use of the service.
- Frequently Asked Questions (FAQs): Answers to common questions that users may have regarding the Genome Portal.
- Glossary: An alphabetically arranged list providing definitions for terms on the website that might be unfamiliar to users.
- About: Overview of the Genome Portal service, terms of use, privacy policy, funding, and implementation details.
- Contact: How to get in touch with the staff behing the Genome Portal.
- Cite us: Guidelines on recommended citations for the Genome Portal website, species pages, data files, and genome browser.
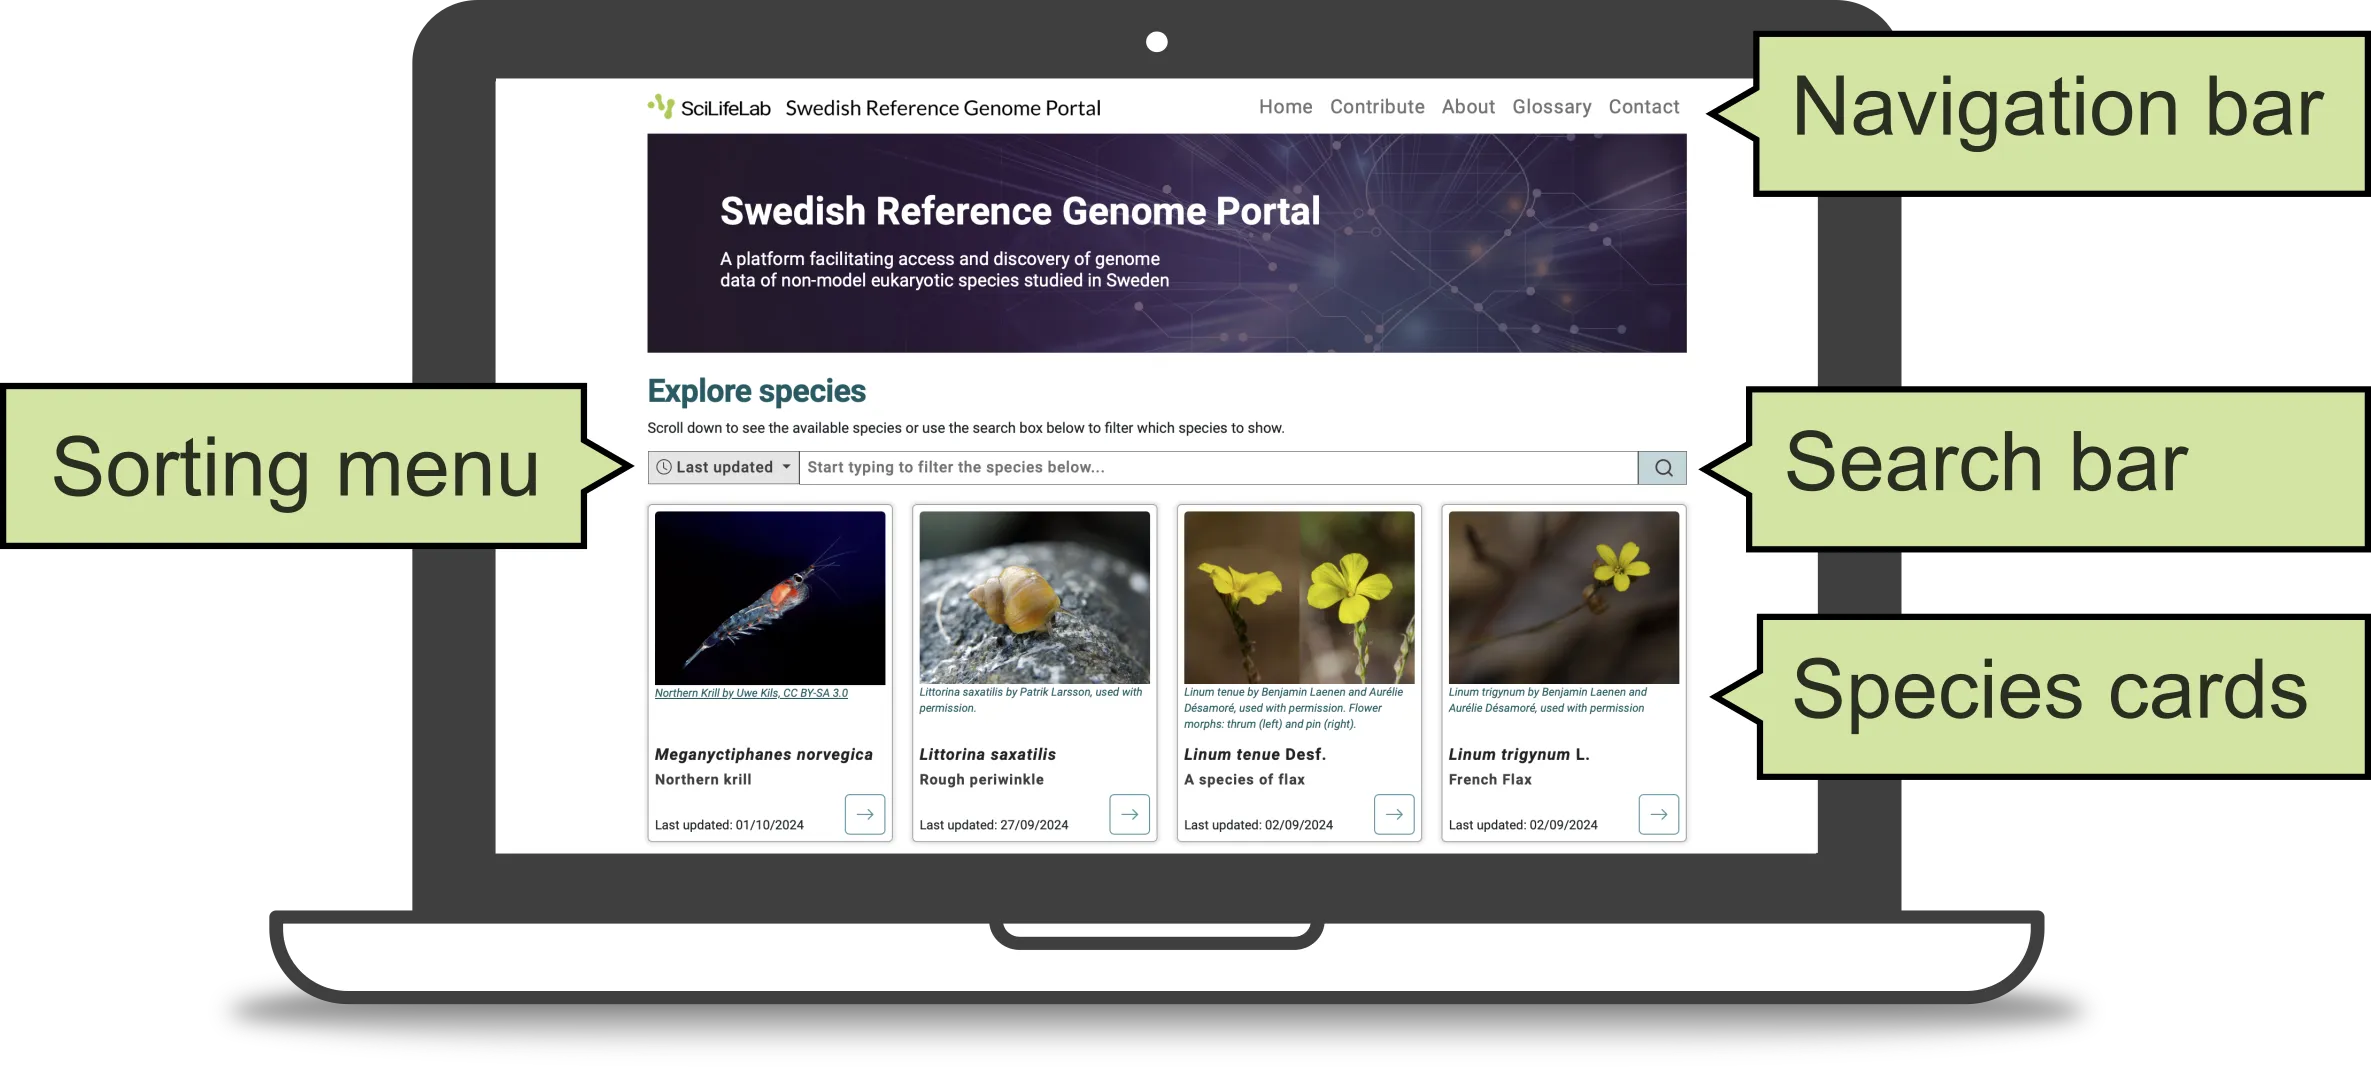
Figure 1. Home page of the Genome Portal.
The search bar allows you to find or filter species displayed on the Genome Portal. Simply type the scientific or common name of a species of interest into the search bar, or use the sorting menu (to the left of the search bar) to arrange the species cards (below) in alphabetical order.
The species cards show brief information about each species displayed on the Genome Portal. They include a species photo, scientific and common name, and the date it was last updated. Species cards are arranged with the most recently added species shown in the leftmost position. As the list of species grow, we plan to add pagination to this section.
1.2. Species page
Each species included in the Genome Portal has its own Species page, which consists of four main components: Description tab, Genome assembly tab, Download tab, and a link to the JBrowse genome browser, which opens in a new window and displays annotation data tracks.
The following sections provide further details on each component.
Description tab
This tab presents general information about the species (Figure 2), including:
- Scientific and English common species names.
- Photo.
- Taxonomic classification, retrieved from ENA (the European Nucleotide Archive).
- General description.
- Recommended citation for the species page on the Genome Portal and the original publication of the data displayed on the portal.
- References used in the general description of the species.
- Link to the genome browser displaying the genomic data (open sin a new window).
- Interactive map of observation (occurrence) data, retrieved from the Global Biodiversity Information Facility, GBIF.
- Vulnerability status, retrieved from the International Union for Conservation of Nature, IUCN, and Artdatabanken, SLU Swedish Species Information Centre (if available)
- Links to external resources such as the Swedish Biodiversity Data Infrastructure (SBDI), GBIF, and Genomes on a Tree (GoaT).
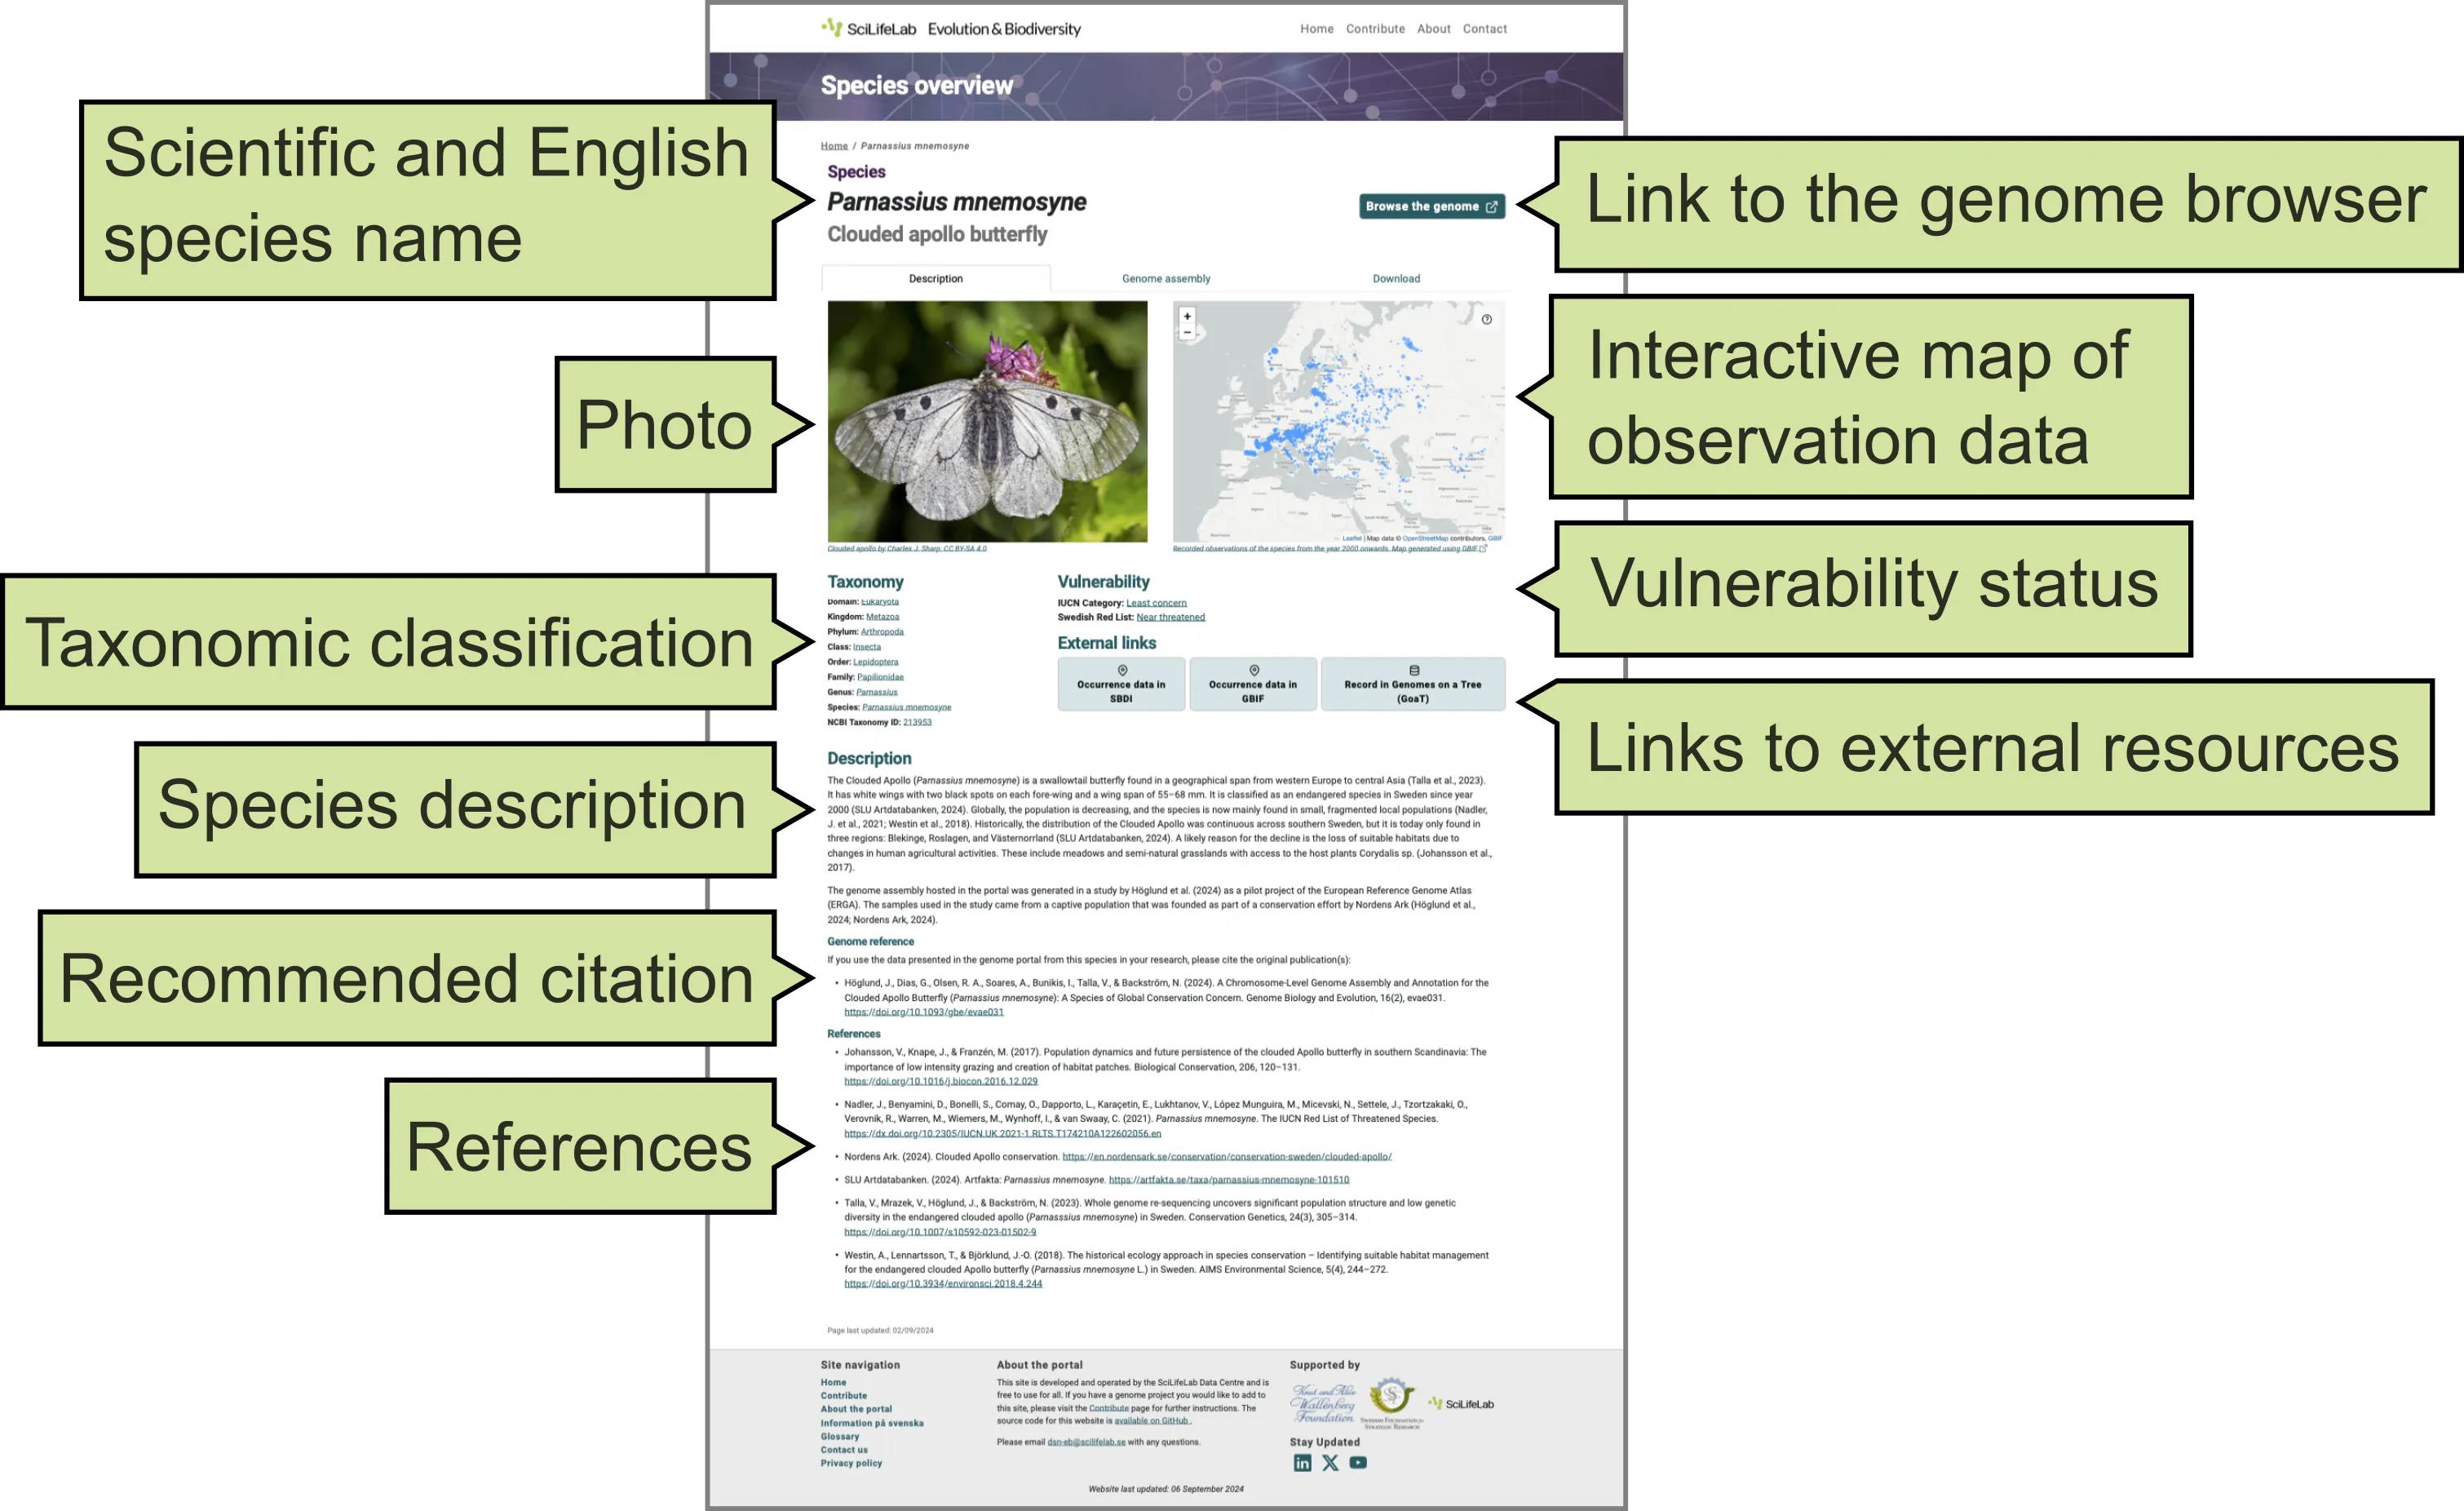
Figure 2. Description tab of a Species page on the Genome Portal.
Programmatic information retrieval
As mentioned earlier, some information shown on the Description page is programmatically retrieved from external sources. Below is a brief description of how this is accomplished.
- Taxonomic classification: To get taxonomic information for a species included in the Genome Portal, a Python script named
get_taxonomy.pyhas been developed. This script is located in thescripts/folder of the Genome Portal’s GitHub repository, which hosts the website’s source code. This script file is a module within another script,add_new_species.py, which contains theget_taxonomyfunction. This function retrieves the taxonomic information for a species and saves it to a JSON file (.json). The script utilises the ENA REST API to obtain the species taxonomic data. - Map of observation (occurrence data): To obtain occurrence data and add a map layer or background, the GBIF API is used. The occurrence data is projected onto a map using the javascript library leaflet. To retrieve the occurrence data, only the GBIF species ID is needed, which can be obtained by following the instructions below.
- External links: The SBDI and GBIF species ID are obtained by searching the species’ scientific name using the GBIF API. These IDs can then be used to construct web addresses, as both sites have predictable URLs for any species. For example:
https://www.gbif.org/species/[GBIF_ID_HERE]. Similarly, for the link to GoaT, the URL can be created using the species’ scientific name and NCBI (National Center for Biotechnology Information) taxonomy ID, as in:https://goat.genomehubs.org/record?recordId={str(tax_id)}&result=taxon&taxonomy=ncbi#{species_name}. If any of these automated searches fail, a warning is displayed, so these values can be added manually.
Genome assembly tab
This tab provides information about the genome assembly (Figure 3), including:
- Associated information from ENA.
- Links to the genome assembly in ENA and NCBI.
- Assembly and annotation statistics from the original publication of the genome assembly.
- The scientific article where the genome assembly was published.
- Funding sources that supported the generation of the genome assembly.
- Acknowledgements.
- Link to the genome browser displaying the genomic data (open sin a new window).
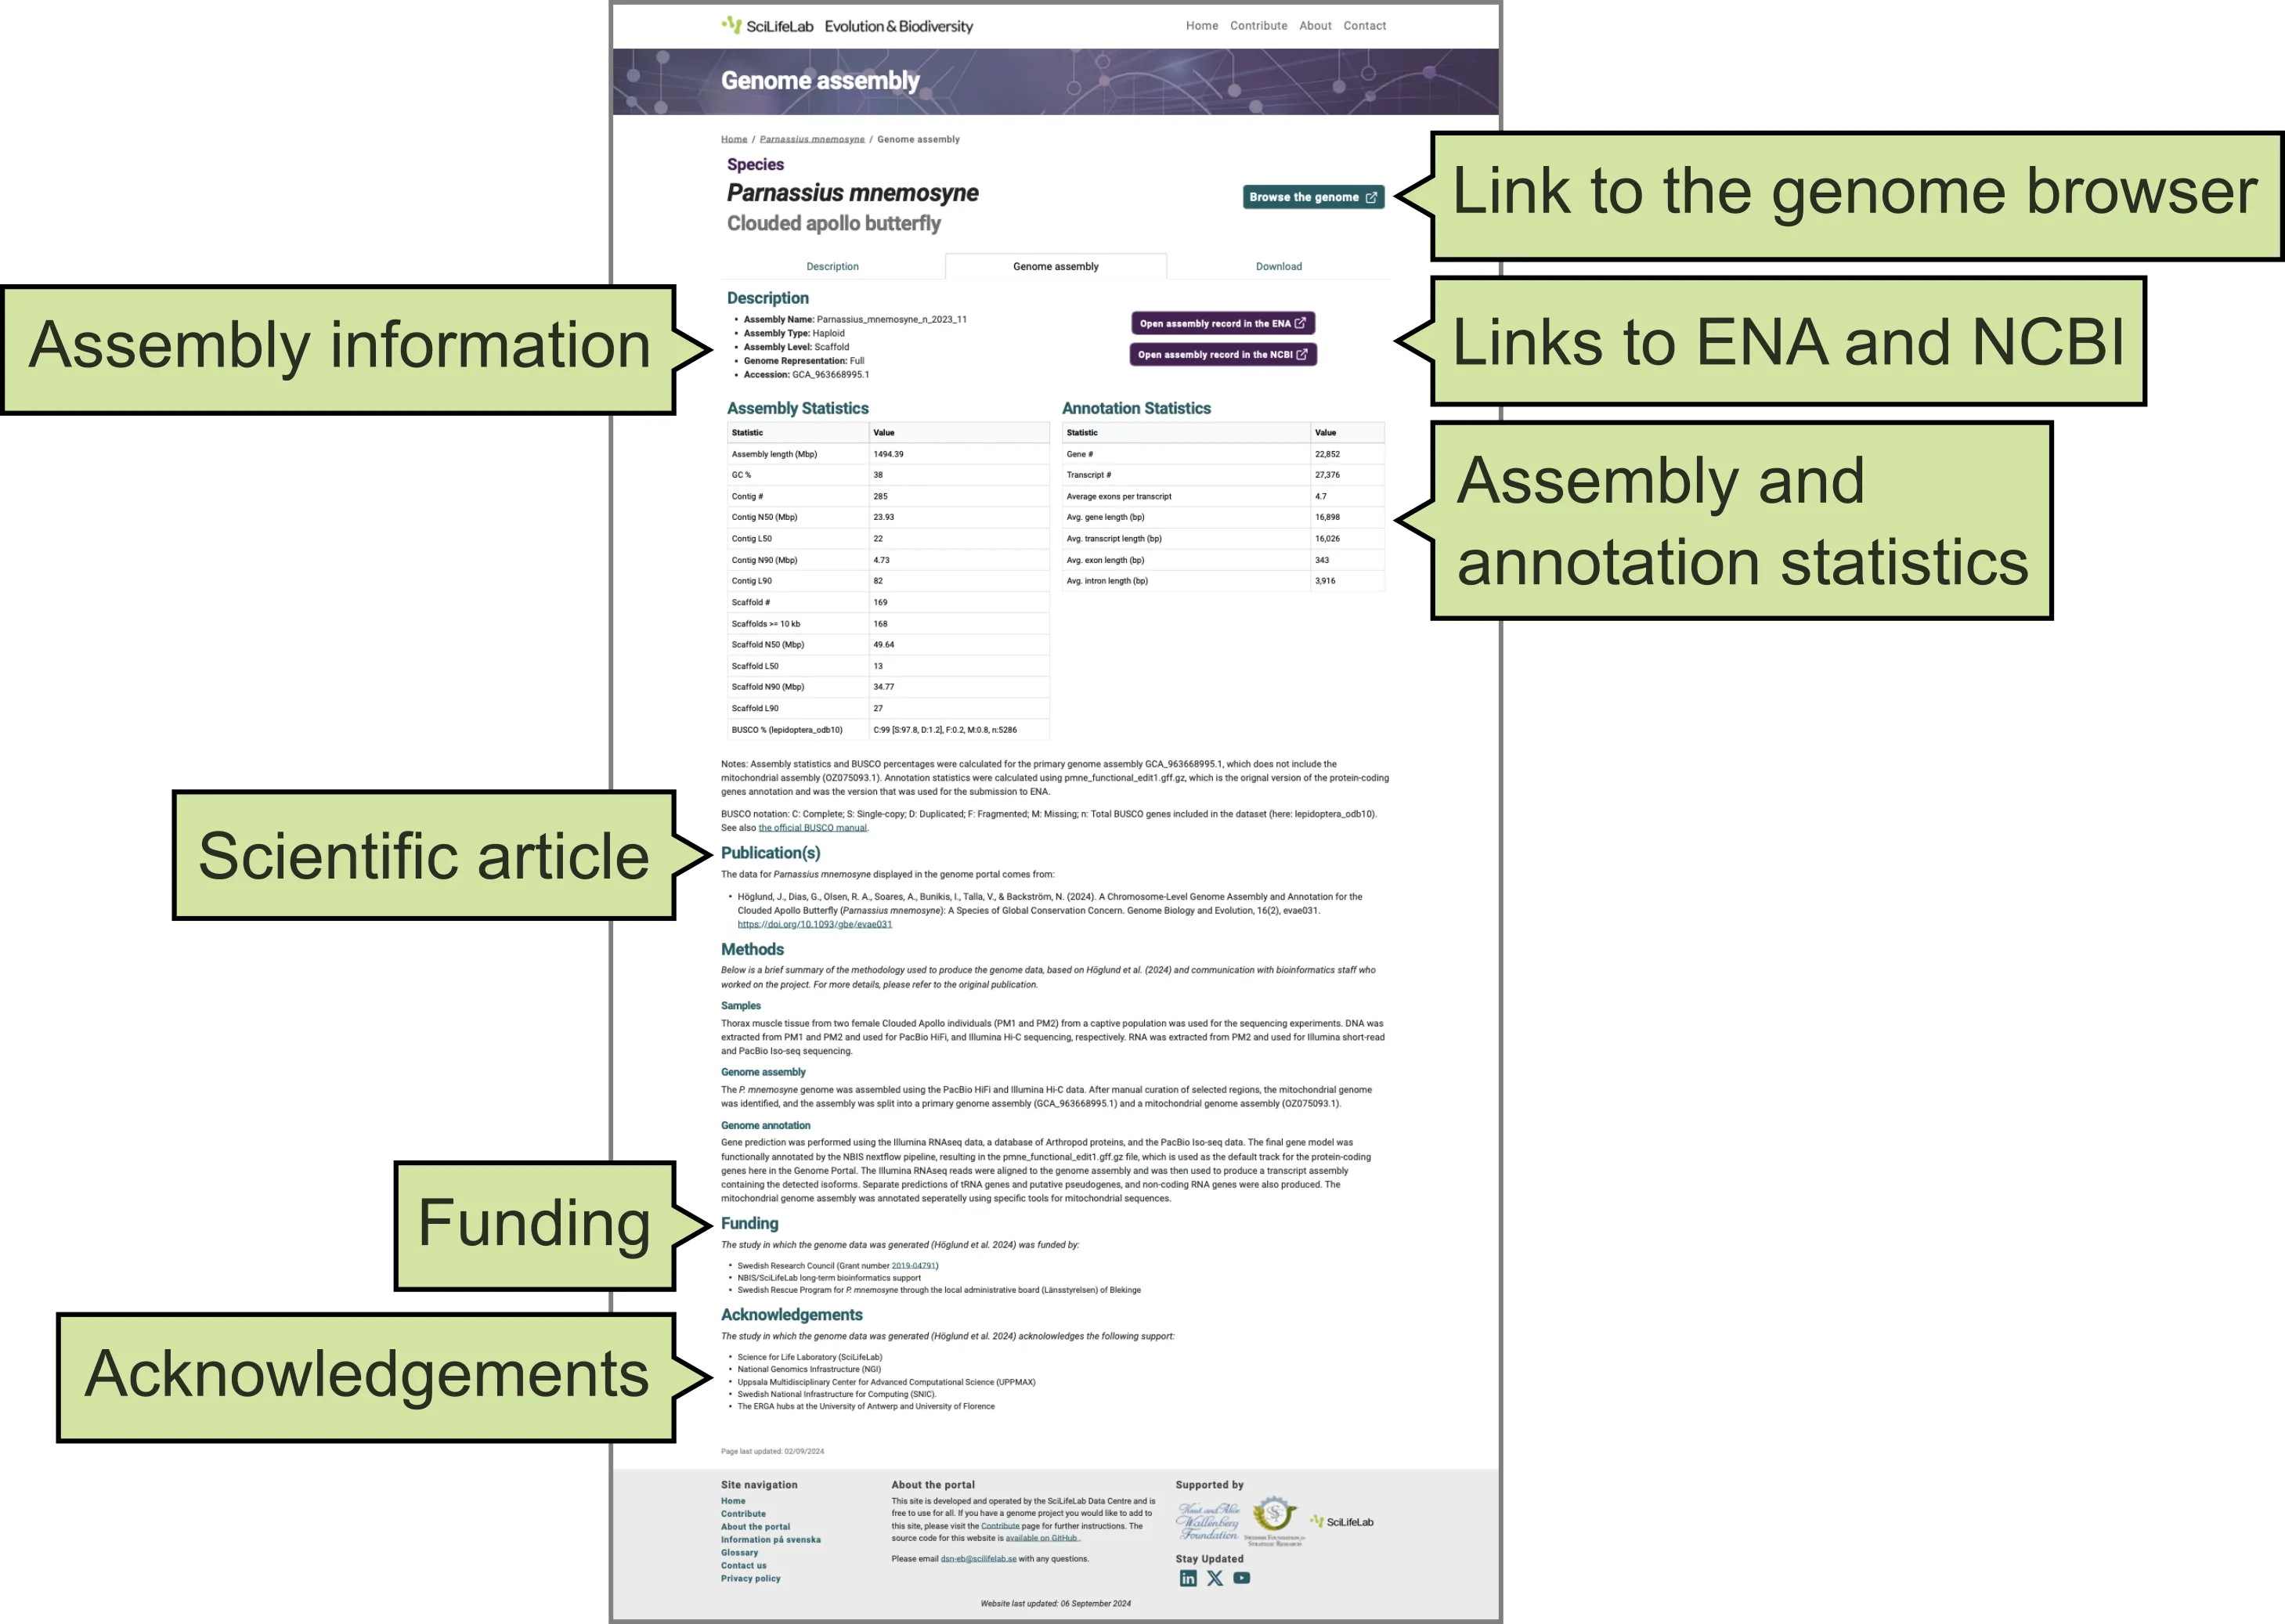
Figure 3. Genome assembly tab of a Species page on the Genome Portal.
Download tab
This tab presents a table with contextual information (metadata) about the data files displayed on the Genome Portal (Figure 4), including:
- Data track name as shown in the genome browser.
- Data track description
- External links: Download (data file), Website (repository), Article (publication).
- Accession number or DOI.
- File name.
- Principal investigator name.
- Principal investigator affiliation.
- Date the data was first listed on the Genome Portal.
- Link to the genome browser displaying the genomic data (open sin a new window).
Use the toggle in the upper-right corner of the table to switch between default and expanded table views.
The ‘Links’ column provides buttons to download the original data file, visit the website of the public repository where the data was obtained, and, if applicable, visit the associated scientific article(s) related to the data.
Below the table, you will find links to download the table as a JSON file, open the refNameAlias text file in a new window (used in JBrowse to set aliases for differing sequence header names, e.g., to define that “chr1” is an alias for “1”), and open the Glossary page in a new window.
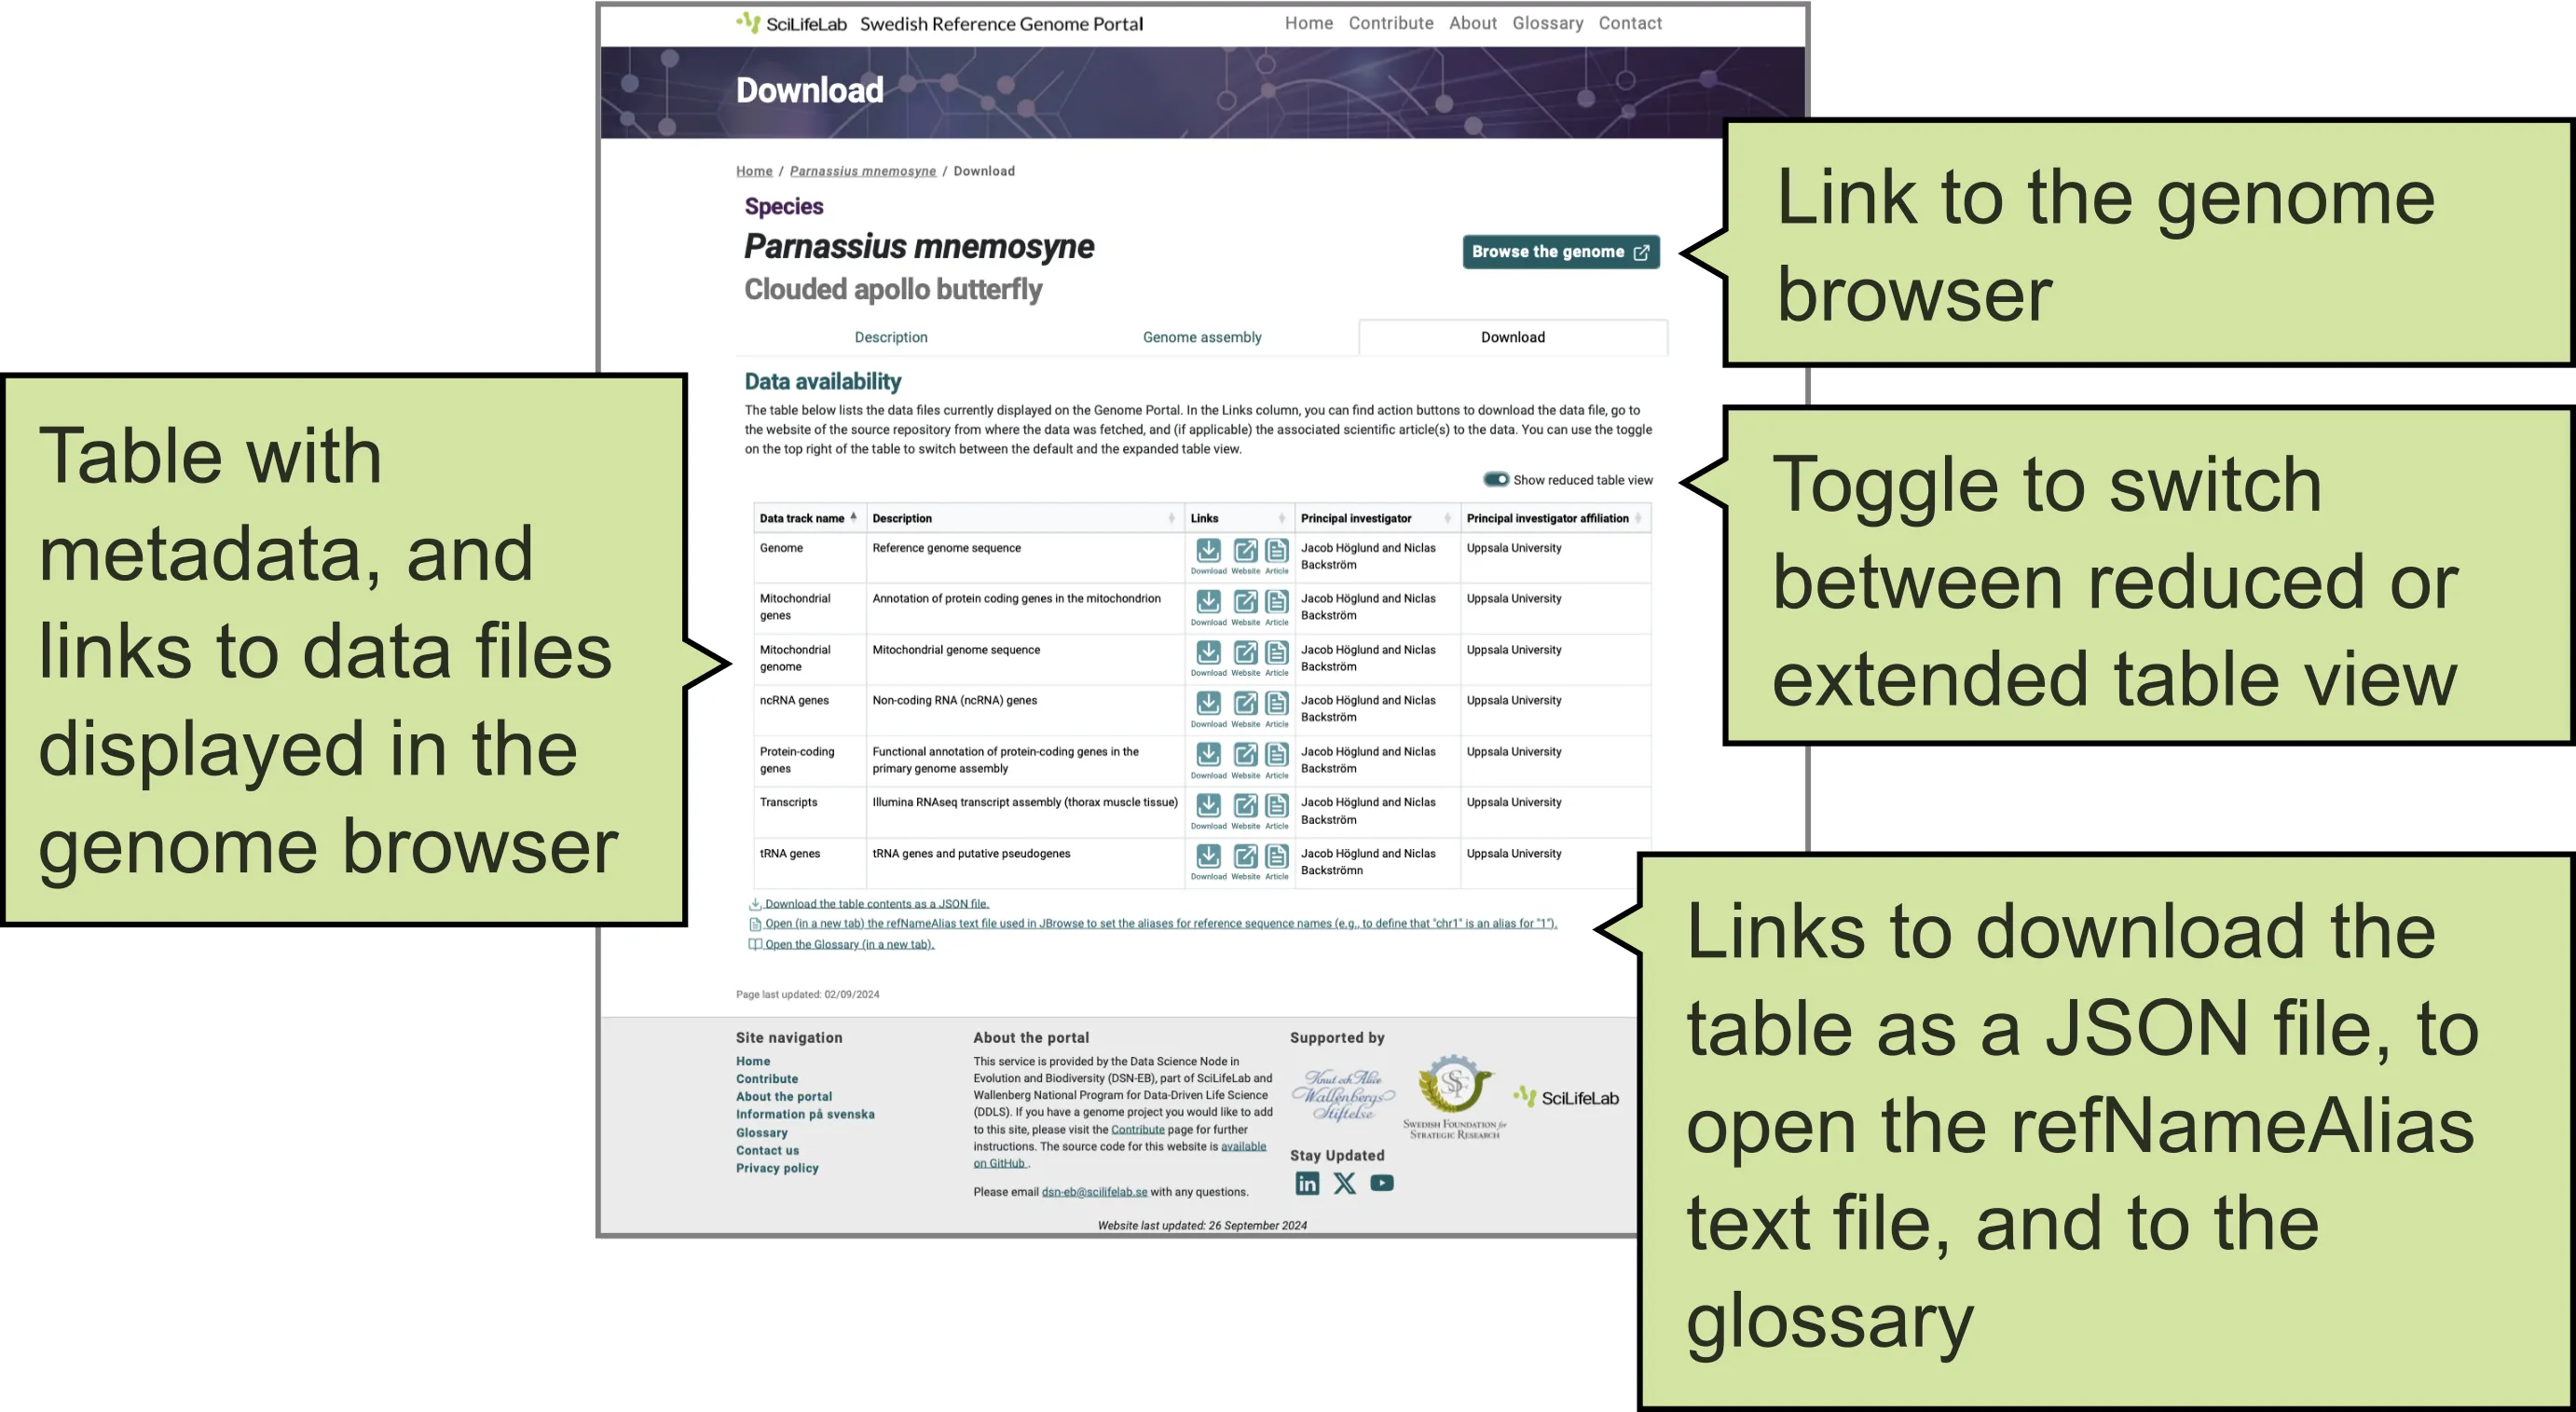
Figure 4. Download tab of a Species page on the Genome Portal.
Genome browser
When you click the Browse the genome button in the upper-right corner of a Species page, a JBrowse 2 genome browser opens in a new window, displaying the data tracks for the current species (Figure 5).
For a definition of what a genome browser is and its utility, visit the FAQ page.
Below, you will find a brief description of basic functionalities of the JBrowse 2 genome browser, adapted from the JBrowse 2 documentation and publication.
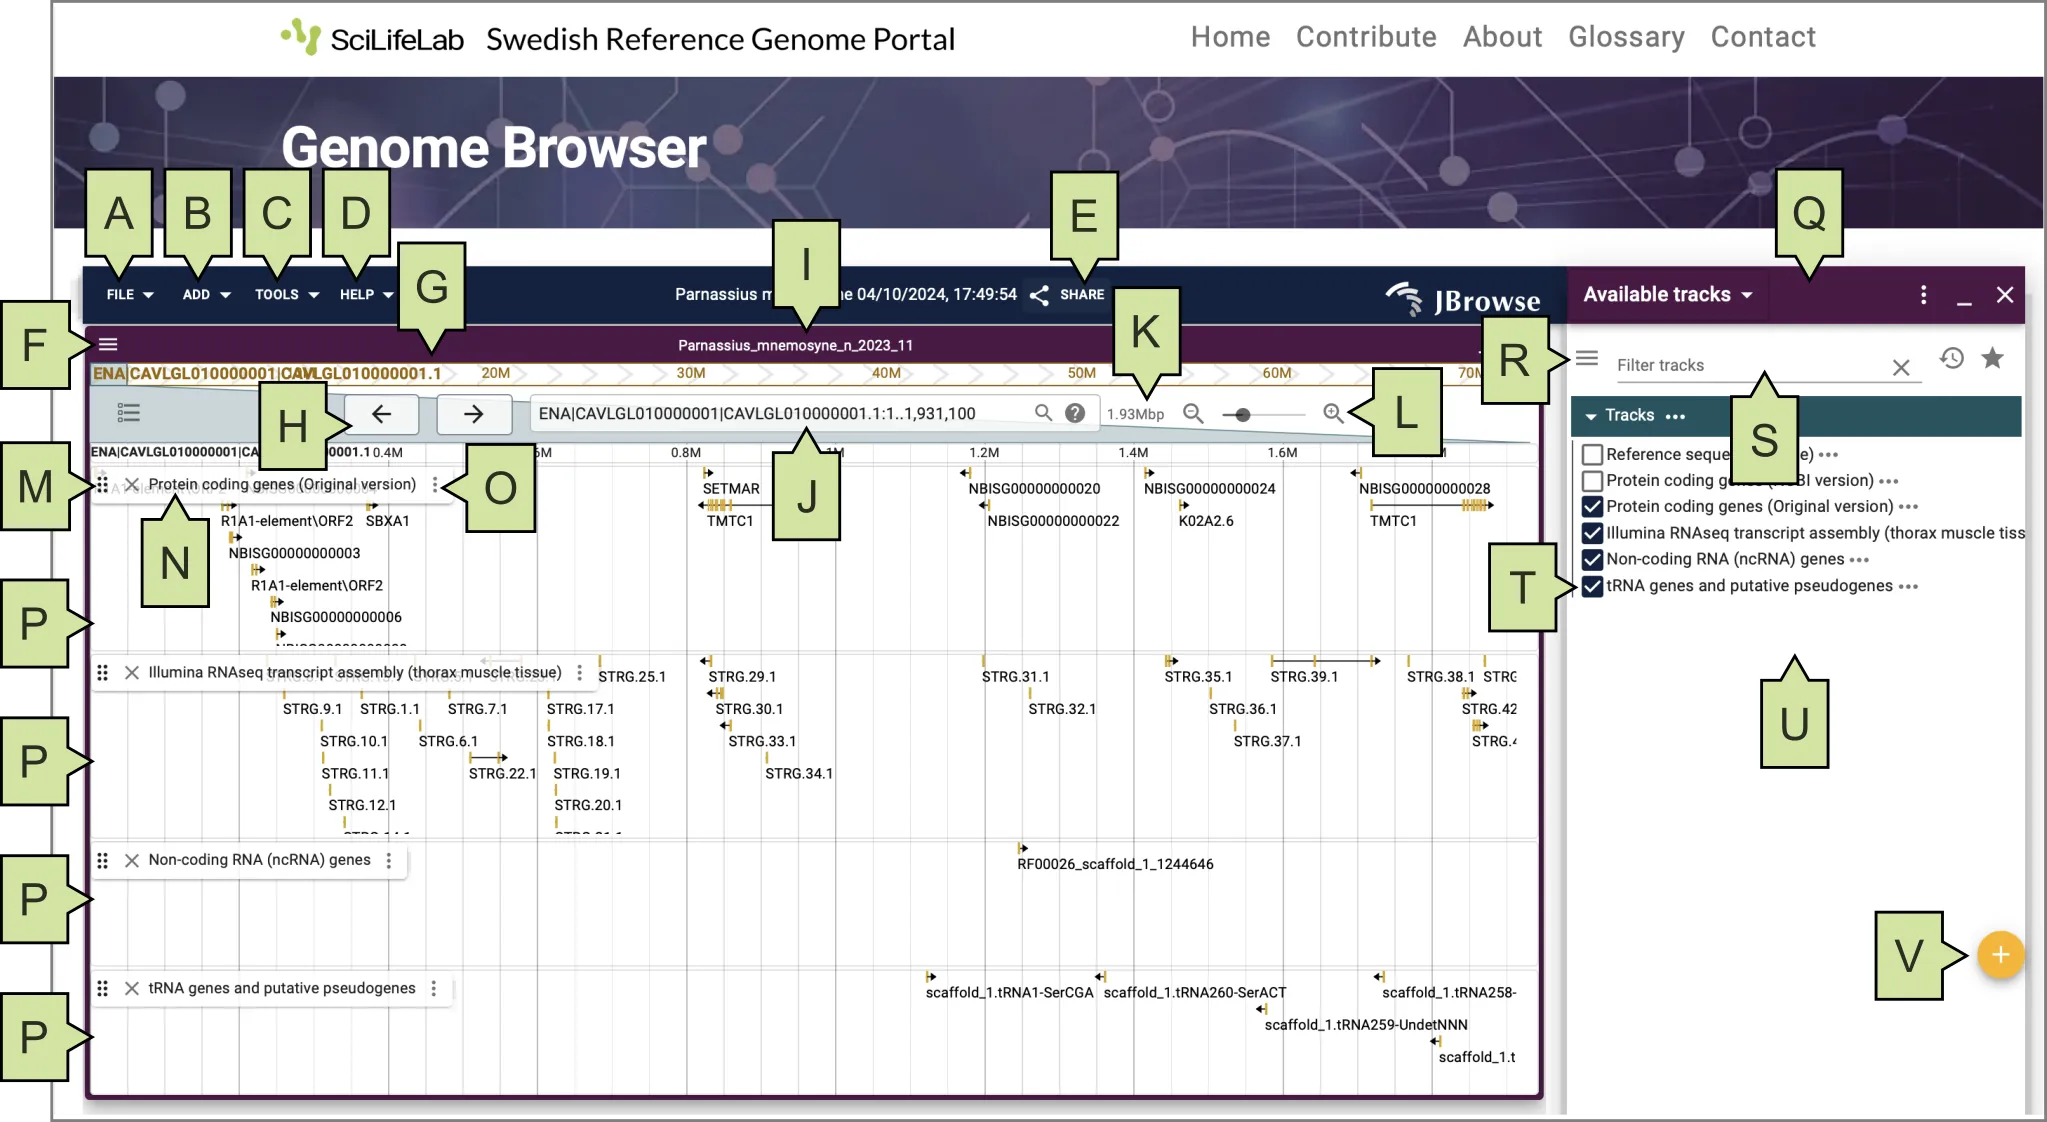
Figure 5. Linear genome view in the JBrowse 2 genome browser embedded within the Genome Portal. (A) FILE menu; (B) ADD menu; (C) TOOLS menu; (D) HELP menu; (E) SHARE link; (F) VIEW menu; (G) Reference sequence name; (H) Pan buttons; (I) View name; (J) Location and search box; (K) View size; (L) Zoom buttons or slider; (M) Track handle; (N) Track name; (O) Track menu; (P) Data tracks; (Q) Widget side panel; (R) Track selector menu; (S) Track selector filter; (T) Track selector box; (U) Track selector area; (V) Add track/connection button
To navigate along the genome (scroll left to right), use the pan buttons in the top-left corner of the window (Figure 5H).
To zoom in or out, use the Zoom buttons or slider in the top-right corner (Figure 5L).
To reorder data tracks vertically, use the Track handle (Figure 5M) located to the left of each Track name (Figure 5N).
To search for a particular genomic location, type in the search box (Figure 5J) any of these options:
- Region and location, e.g. chr1:1..100 or chr1:1-100 or chr1 1 100
- Discontinuous regions, delimited by a space, and opening them side-by-side, e.g. chr1:1..100 chr2:1..100
- Any of the previous options and appending [rev] to the end of the region will horizontally flip it, e.g. chr1:1-100\
- By gene name or feature keywords (if configured), e.g. BRCA1
For further information, visit the JBrowse Basic usage documentation.
2. Useful genome browser features
Open a data track
To open a new data track within the genome browser for a species in the Genome Portal:
- Access the ‘Add a track’ form by clicking on the File menu (Figure 5A), then Open track, or by clicking the circular plus (+) icon (Figure 5V) in the bottom right corner of the ‘Available tracks widget’ (right-side panel, Figure 5Q).
- In the ‘Add a track’ form, provide a URL to a file to load, or open a file stored in your local machine.
Share sessions
To share a session with others:
- Click the Share link (Figure 5E) at the top center of the window.
- A window will appear displaying a URL for your session. To copy the URL, click on the Copy to clipboard button.
Bookmark genomic regions
The Bookmark regions widget allows you to save a list of specific regions you want to revisit later.
To create a bookmark, click and drag on the top of the linear genome view, and select Bookmark region. The new bookmark will be displayed on the Bookmark regions widget (right-side panel).
To customise a specific bookmark, make sure it is selected with a check box, then click the row corresponding to the Label column and type labels/notes/annotations/comments, or click the row of the Highlight column to change the highlight color.
To export bookmarks as a BED or TSV file, click the Bookmark regions widget menu on the top-left corner (seen as three gray horizontal lines), select the preferred format, and click Download. The file will be saved in the Downloads folder on your local computer.
To import bookmarks from a BED or TSV file, click Bookmark regions widget menu, select Import and Import from file.
To share bookmarks via a URL link, click the Bookmark regions widget menu, select Share and Copy share link.
To import bookmarks from a shared URL link, click the Bookmark regions widget menu, select Import and Import from share link.
To delete bookmarks from your computer, select the desired bookmarks using the left checkboxes, the Bookmark regions widget menu, and select Delete.
Export visualisation as an SVG file
To export genome browser visualisations as publication-quality images in SVG (Scalable Vector Graphics) format:
- Click the View menu (Figure 5F) at the top-left corner of the window (seen as three horizontal lines on the purple banner)
- Click Export SVG. Choose a filename, a ‘Track level’ positioning and a ‘Theme’, and press Submit.
The SVG file will be saved to the Downloads folder on your machine.
The advantage of using vector files is that, unlike pixel-based raster files such as JPG or PNG, vector files store images using mathematical formulas based on points and lines on a grid. This allows SVG images to be scaled and modified without any loss of quality. SVG files can be easily edited using a variety of graphic software, such as Inkscape or Illustrator.
Obtain the full sequence or the coding sequence of a gene
To view details or annotations for a specific genomic feature:
- Click on the genomic feature of interest (e.g., a protein-coding gene). A Feature details widget will appear on the right, in the Widget side panel area (Figure 5Q).
- Scroll down to browse the feature details. To obtain the full gene sequence, click the Show feature sequence button of the top panel, which corresponds to the gene. To obtain the coding sequence (CDS), go down to the Subfeatures section, and click on the correspondent Show feature sequence button.
3. Advanced features and additional resources
JBrowse 2 offers many additional visualisation features beyond those mentioned here, including HiC contact maps, quantitative tracks (e.g., depth of coverage for copy number variation, CNV, profiling), a Structural Variant (SV) inspector view to examine breakpoint splits, a Variant widget that contains a table indicating the calls made in a multi-sample VCF, and more.
For examples of the visualisation JBrowse 2 offers, visit the visualisations gallery page.
Additional advanced features are available through plugins developed by the research community. These plugins add functionality beyond the core application, such as new data adapter, or custom track types (e.g., Manhattan plots for GWAS, genome-wide association study). Visit the plugin store to learn more.
